Overall Equipment Effectiveness Dashboard
The Overall Equipment Effectiveness (OEE) dashboard displays metrics around the OEE standard.
OEE is a powerful metric and industry standard that provides a complete picture of the packaging operation's efficiency. By tracking availability, performance, and quality, OEE pinpoints areas for improvement across the entire workflow. It also shows graphs and other supportive metrics.
OEE applies Planned Production schedules to the scores unless the switch at the top of the dashboard is turned off. For more information on Planned Production, see Planned Production.
 |
OEE is an Enterprise feature only. For users to gain access to the OEE dashboard, they must have an Enterprise Reporting license and the Access Overall Equipment Effectiveness Reporting Permission added to their role. For information on updating Roles, see the PackNet Core User Manual [MANUAL-00009].
OEE Calculation
OEE measures the percentage of planned production time that is truly productive. It's calculated by multiplying three key factors:
OEE = Availability x Performance x Quality
0.2% = 6% x 4.4% x 91.8%
Availability: This measures the percentage of scheduled time that equipment is actually running and producing. It takes into account downtime due to unplanned stops (e.g., breakdowns, material shortages) and planned stops (e.g., changeovers, scheduled maintenance).
Availability = Run Time / Planned Production
6% = 126.64 / 2,115.6
Performance: This assesses how well equipment is running when it is operational. It considers factors like ideal cycle times, speed losses, and small stops.
Performance = Total Count / (Ideal Run Rate x Run Time)
4.4% = 4,801 / (857 x 126.64)
Quality: This evaluates the percentage of successful products produced compared to the total.
Quality = Successful Count / Total Count
91.8% = 4,408 / 4,801
By tracking these three components, OEE provides a holistic view of the packaging process, enabling users to identify the root causes of inefficiency and make targeted improvements. Although the data provided is from specific Packsize machines, OEE provides insights into what might be impacting the performance of the Packsize machine.
OEE Cards
The OEE dashboard provides four OEE cards that display a score in percentages and supplemental metrics that impact each score. Users can filter these scores by adjusting the date range with the date dropdown and selecting specific machines with the machine filter.
The Availability card displays the overall Performance score and three supplemental metrics.
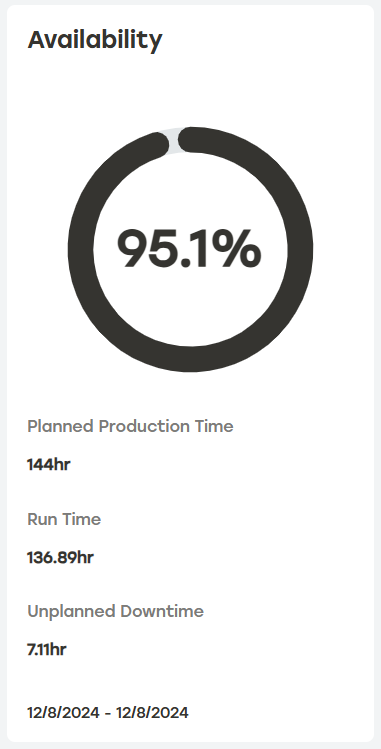 |
Availability Supplemental Metrics
Planned Production is the total production time in hours across all machines for the selected date range. The example card above shows a single day with a site that has six machines. Each machine has a schedule set for 24 hours. This means that PackNet is considering six machines running for 24 hours each which equals 144 hours. Planned Production schedules can be set for each machine for improved accuracy. For more information see Planned Production.
Run Time is the total time the machine was either running or ready to work. PackNet Report uses machine statuses to determine when a machine was running or ready for work. Statuses include Online, Paused, or Changing Corrugate. Any other status will negatively impact availability. In the example card above, the machine was running or ready for approximately 137 hours.
Unplanned Downtime is the amount of time the machine was in a state that indicates it is not ready for work due to the machine being offline, in service, or an error state.
The Performance card displays the overall Performance score and three supplemental metrics.
Note
The Performance score is a measure of throughput relative to run time, not just a throughput metric. It's common for scores to be lower when there isn't much product to process, even if the machine has high Availability. However, when both Availability and Performance are low, it may indicate issues that need attention. For more insights into machine availability and errors, refer to the Errors & Availability dashboard.
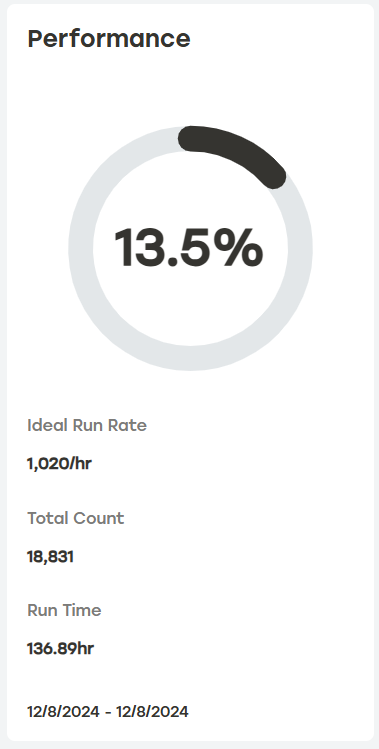 |
Performance Supplemental Metrics
Ideal Run Rate is the machine's designed production sustained speed measured in cartons per hour.
Total Count is the total number of cartons processed by the machine.
Run Time is the total duration the machine was operational or ready to work. When enabled, Planned Production is applied to this metric. In this example, the run time is approximately 137 hours. In PackNet Report, machine statuses such as Online, Paused, or Changing Corrugate indicate that the machine is running or ready for work. Any other status will negatively impact availability.
The Quality card displays the overall Quality score and three supplemental metrics.
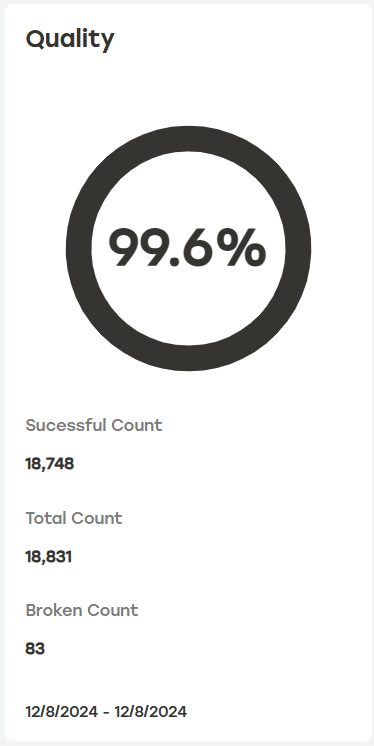 |
Quality Supplemental Metrics
Successful Count is the number of cartons that were successfully created by the machine(s).
Total Count is the total number of cartons attempted by the machine(s).
Broken Count is the number of cartons that were unsuccessful.
OEE quickly assess the machine's true productivity by combining Availability, Performance, and Quality. The OEE score alone does not tell the whole story. It is vital to utilize each score together to pinpoint areas of improvement.
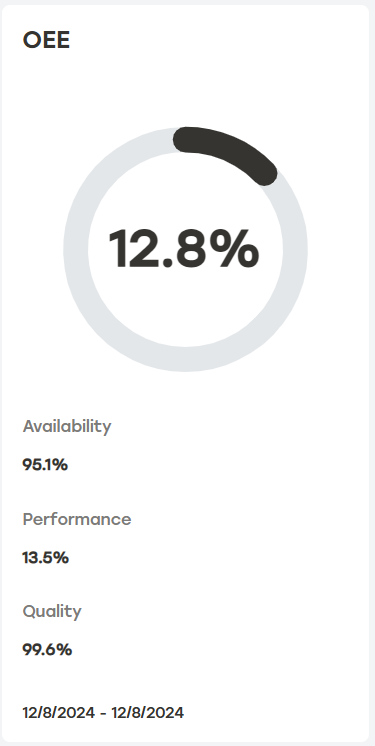 |
OEE Supplemental Metrics
The supplemental metrics are the scores found in each of the other cards.
OEE Over Time Graph and Table
The OEE dashboard features an interactive card that displays OEE scores over a selected time period that can either be displayed as a graph or a table. Use the machine filter and date range dropdown to define the results further. Selecting the download icon will download a CSV file of this table.
OEE Over Time Graph View
The OEE Over Time graph allows users to enable or disable individual scores. Users can also hover over the graph to see a dialog showing a score for a specific date and time.
 |
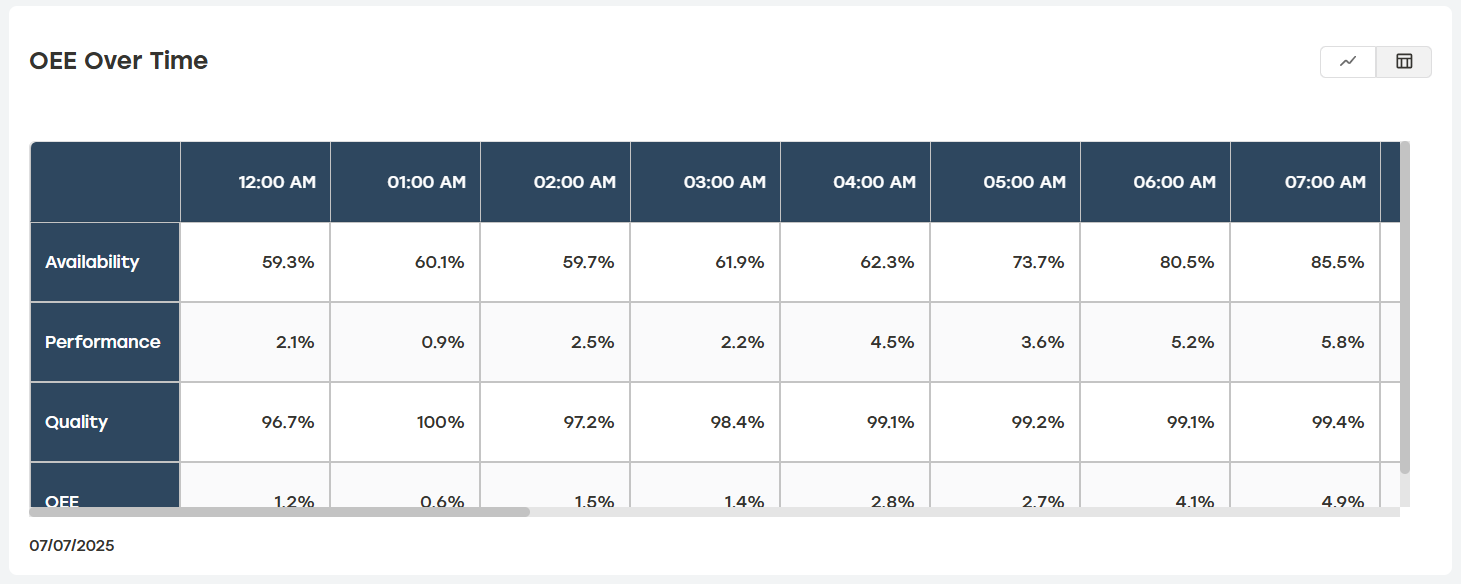
OEE Over Time Table View
When Table View is selected, the OEE Over Time table displays the scores in tabular form presented at regular intervals throughout the selected period.
 |