Availability
The Availability dashboard displays details about machine uptime and status (by hour).
Site Availability Status
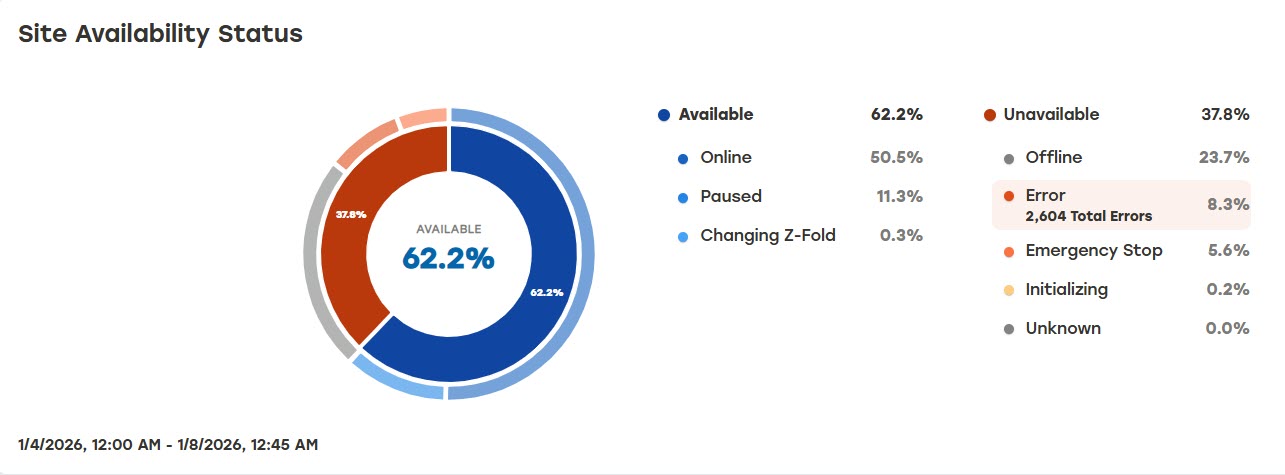
Site Availability Status shows total site availability, unavailability, and errors. This card has a pie chart that displays the combined status percentage across all machines for a given time period. The Available and Unavailable lists show detailed information breaking down each status further.
 |
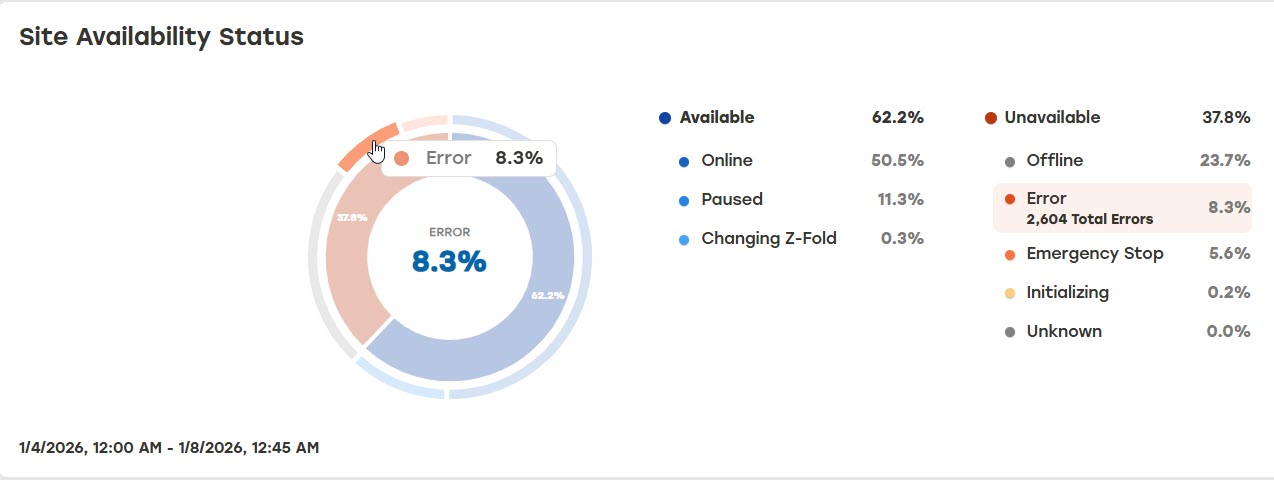
Hovering over a chart segment displays the percentage and status in the center.
 |
Machine Status by Hour
Note
This chart only displays a single day time frame (e.g., Last 24 Hours). Selecting more than one day will cause the card to display no data for that time frame.
Bar Chart
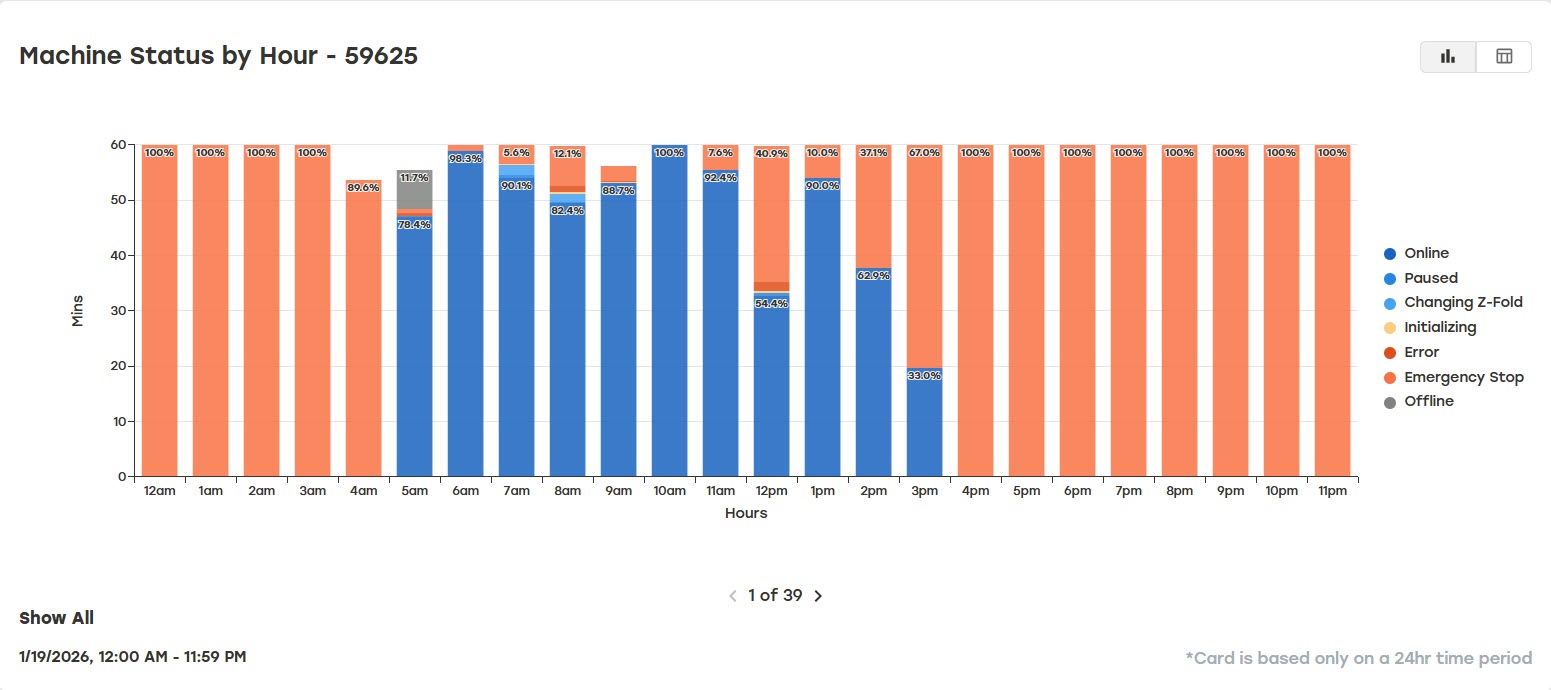
Displays how long a machine was in a certain status.
 |
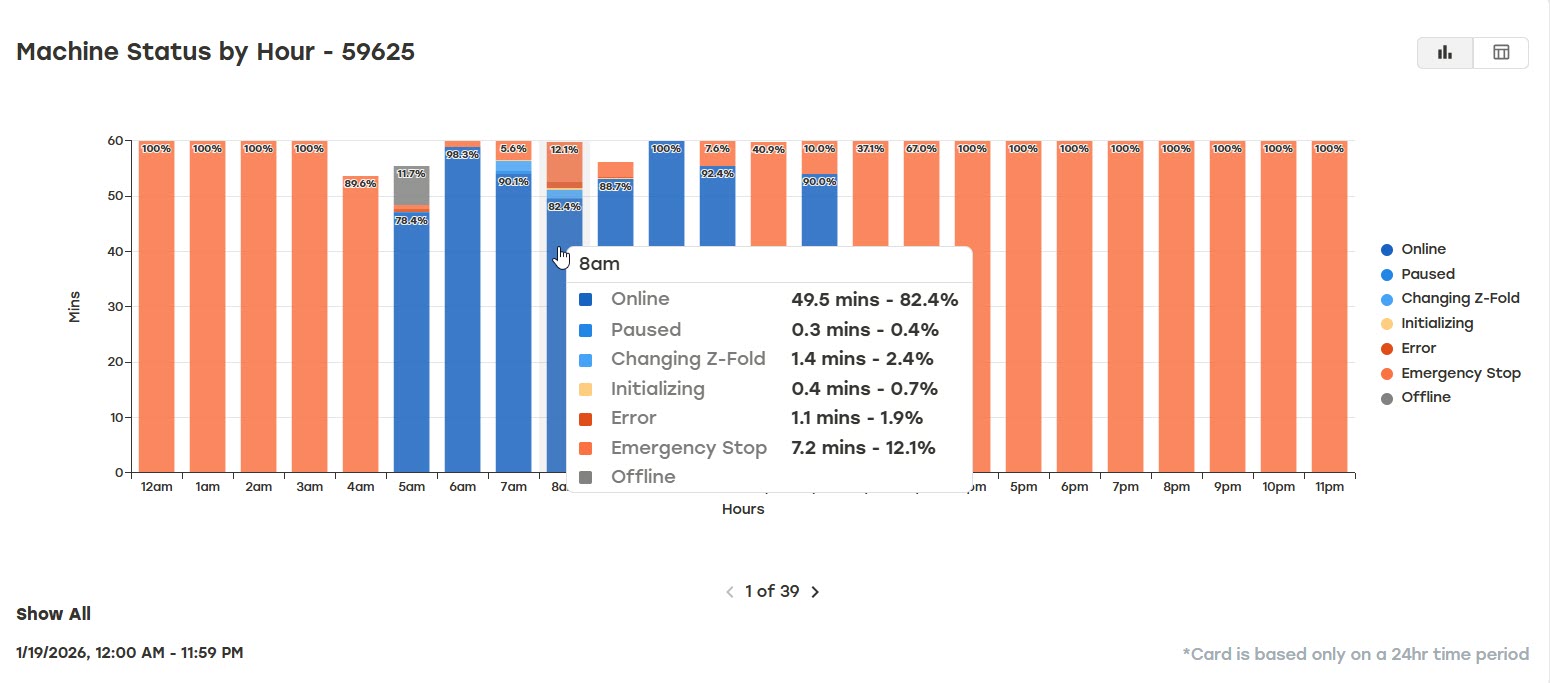
Hovering over a chart segment displays a detailed breakdown for that hour.
 |
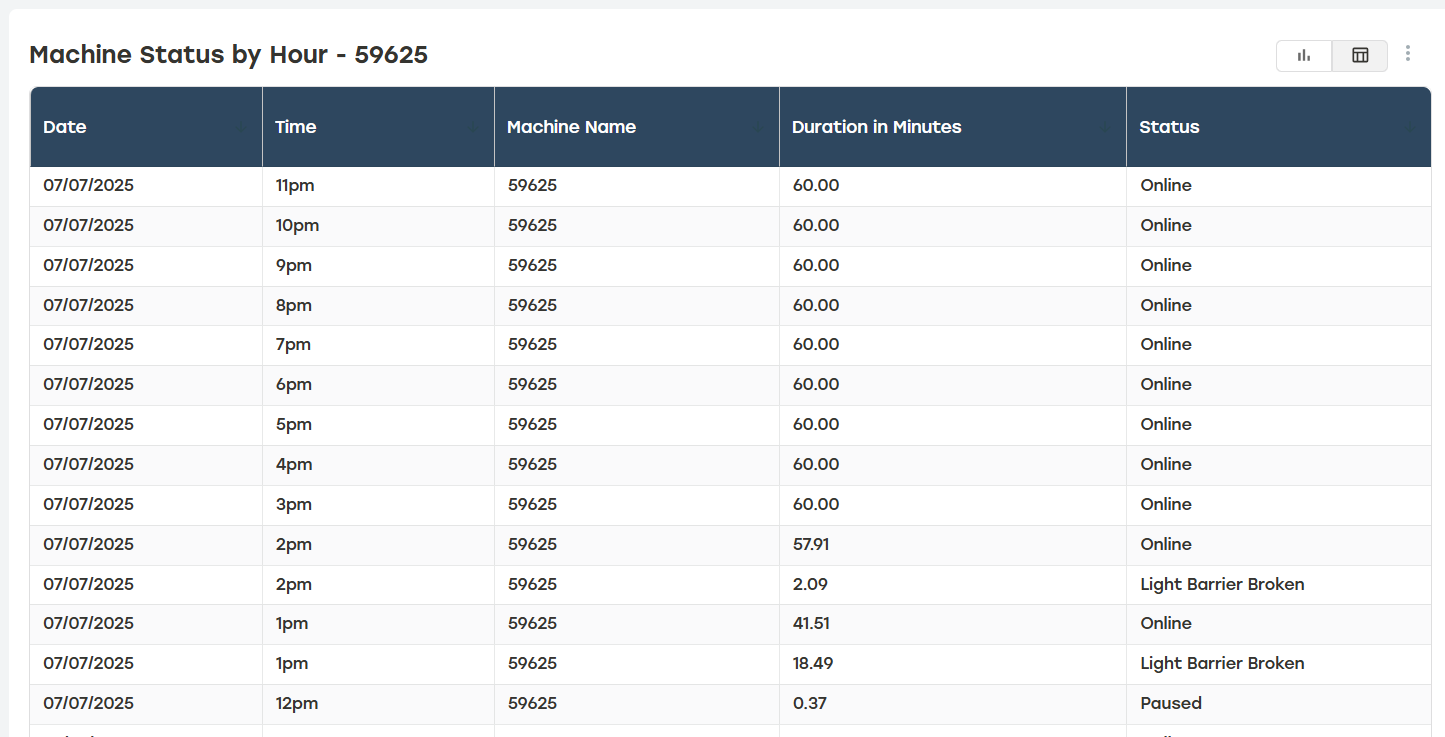
Data Table
Downloadable table of data that powers the chart.
 |
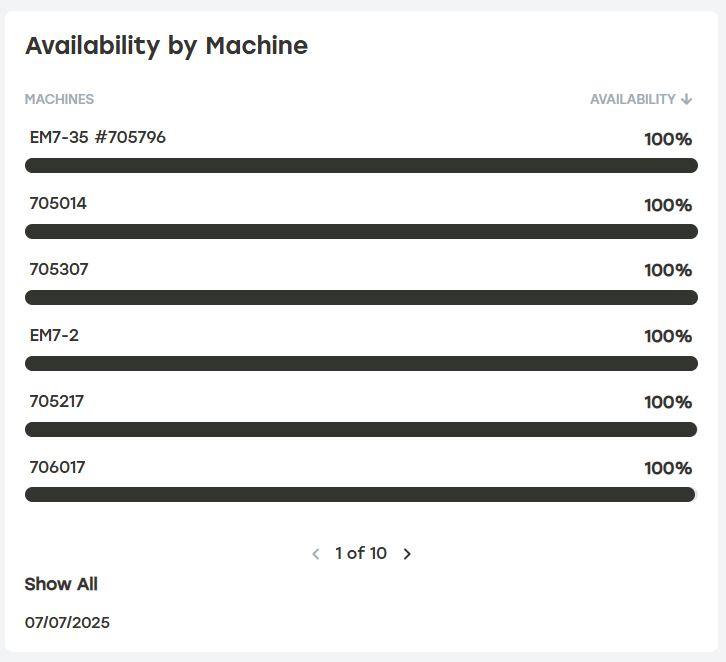
Availability by Machine
Availability score per machine.
 |